Finding values for process variables that will give an acceptable yield of in-spec product is difficult because it is usually not possible to measure all of the product qualities until after the product has been made.
Many product properties can only be measured in the laboratory. This is frustrating for the people operating the plant that makes the product because they get the results only after the event. What the production people would really like is the ability to predict from the process variables what the properties of the final product will be. Then they wouldn’t have to wait for the lab result to tell them they had it wrong and had achieved only mediocre product quality.
Our solution to the multi-variable product quality control problem is very different, complete and available now. It starts by having you combine historical process tag data with product quality results aligned by sample time or batch number in one spreadsheet and works for continuous or batch processes. Buried in this data is a wealth of previously inaccessible information including the actual capability of your process to make product, the extent to which you have used that capability and all the information to determine how process variable values affect product qualities. You already knew that because it was part of your justification of the cost of the data collection system, wasn’t it? That was an act of faith on your part because at the time you justified the data collection system you knew that you didn’t know how you could extract the information from the data you proposed to collect. All you knew was that there wasn’t a way to extract, for instance, the way that process variables affect product qualities in anything resembling a usable form. Well now there is, your faith has been justified and you’ve found the website with the solution all packaged up and ready to use.
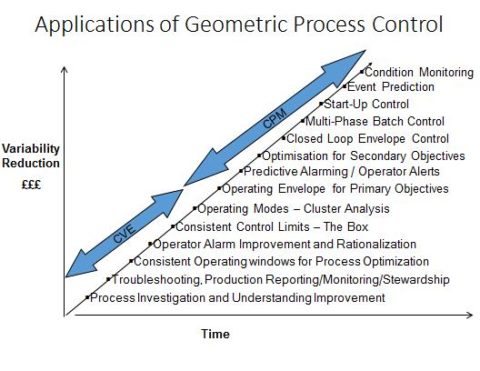
Start by using Visual Explorer (CVE) to visually explore your spreadsheet of data. You’re going to select the data that you consider representative of normal operation and eliminate the abnormal periods. Then you’ll check that what is left is truly representative and covers your whole range of operation of, for instance, ambient temperature. You’ll very probably learn some interesting things about your process too and perhaps puncture some long-held beliefs. Having found the data that represents normal operation, you will then apply the desired specifications to the quality variables and highlight the envelope of process variables where you have been capable of achieving those specifications and, of course, where you have been outside the envelope in both single-variable and multiple-variable excursions in the recent past. You will have done all of this visually and won’t have seen a single equation.
Now pass the envelope to Process Modeller (CPM) which extracts all the relationship information and provides the operator display that allows it to be used. You can try out your model by providing a file of process values from which it can predict the quality variables by reading the file one record at a time in a simulation of real time. The operator display shows all the single and multi-variable violations of the envelope and the currently usable ranges of each process variable relative to the current process operating point. And you still won’t have seen an equation.
Operators find it an easy display to use because it uses only existing process and quality variables, with which they are already familiar. And when the envelope is violated, up pops advice telling the operator what to change and by how much in order to clear the violation. And still you won’t have seen an equation!
‘No Equations’ is a very serious point. Smaller process sites, and many larger ones too, don’t have sufficient engineering time to implement traditional equation-based models or to create and maintain special schematic displays to make them usable by operators. Cutting out equations very substantially increases the number of engineers who can implement multi-variable process control and substantially decreases the man-hours needed too so GPC is a solution for big and small sites.