Generate new insights from past performance to better understand & improve your plant process
A unique form of geometry to convert historical data into a single visual summary. Understand and improve operational performance of batch, grade and continuous manufacturing processes.
- Improve Plant Safety
- Intelligently Increase Consistency
- Increase Plant Profitability
Can you afford to ignore your past performance?
- Are you learning all you can from your plant historian?
- Do you know which variables are contributing most to the variability?
- Are you operating consistently within the operating window to meet KPI targets?
- Are you able to combine process historian data with laboratory analysis, emission measurements etc?
Don't let you plant historian repeat itself!
Save time and take back control of your process with CVE!
01
Reduce Variability
Visualize your process historian to discover which variables are contributing most to your variability.
02
Meet KPI Targets
Find the operating windows and envelopes that show you where to operate to meet all your KPI's.
03
Better Alarm Limits
Find better operator alarm limits in a fraction of the man-days with CVE's method.
04
Reduce Abnormal Events
Detect variables operating out of range and optimise your process to make informed improvements and set better limits.
Your historical operating data and offline quality measurements contain incredible amounts of information about how your process behaves that you really haven’t been able to extract until now. By unlocking this information you can regain control, reduce waste, increase yields, improve product quality, control your emissions and ultimately reduce costs!
Start optimising your process today!
A Smart, Data-driven Approach
We don’t just care about process plant data sets, we care about seeing powerful results through intelligent operational improvements for our customers:
Some of our customer's result's using CVE & CPM
The Most Powerful Interrogation &
Visualisation Technology
C Visual Explorer (CVE) is a powerful industry-leading interrogation tool for subject experts to fulfil their insatiable curiosity across process plant operations by quickly extracting process insights from the data already collected in the plant historians.
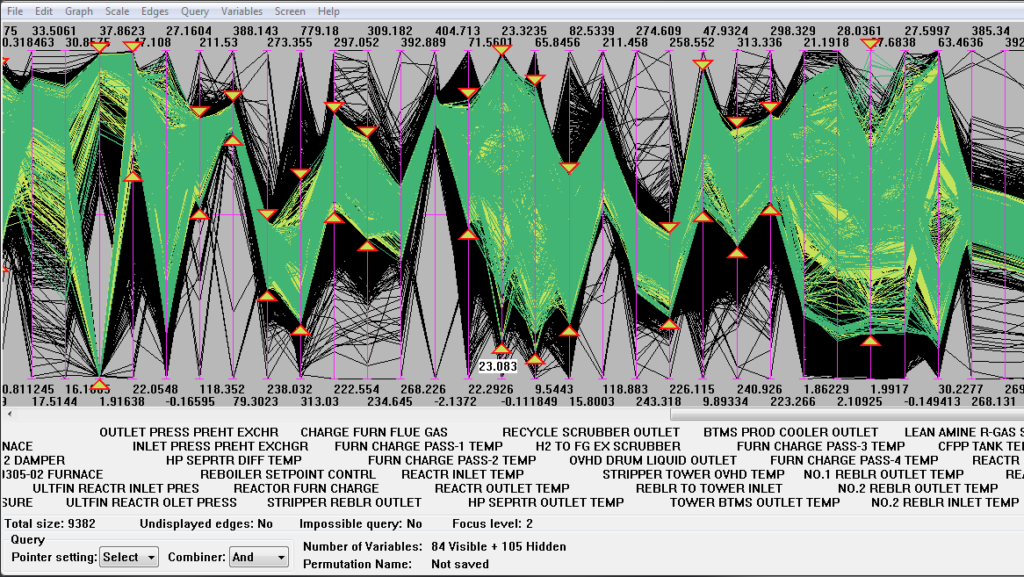
C Visual Explorer (CVE) provides a graphical representation of the values of many hundreds to several thousand process and result variables using a parallel coordinates graph tailored by us as chemical engineers to the particular needs of process plants. The parallel coordinates graph is a coordinate transformation from n-dimensions (each variable is a dimension) to 2 dimensions and many other mathematical properties. This unique visual method allows engineers to quickly see and extract process insight from the data already collected by your historian without involving any mathematics on the part of the user. CVE can be used for continuous and batch processes and even for mixed batch/continuous processes. CVE is fully supported and is continuously being developed.
- Understand your process and how it can best operate by combining process historian data with data from other repositories such as laboratory analyses, emission measurements, raw material assays and more.
- Find the Operating Windows and Envelopes that show you where to operate to meet all your KPIs, not just the ones you can measure in real-time.
- Find better operator alarm limits in a fraction of the man-days you take with today's methods and have immediate alarm performance predictions available as you interactively change alarm limit values before and during the alarm review meeting. Our methods will take you all the way to predictive alarming (requires CPM) if your ambitions extend that far.
C Visual Explorer (CVE) uses a unique form of geometry to convert historical data into a single visual summary. The technology also enables you to select periods when top quality outputs were achieved and then control your process to only mimic these conditions. The result? A better process you are in control of!
Ready To Get Started?

1 - Book A Demo

2 - Build Intelligent Operating Envelopes
3 - Gain New Process Improvements
Powerful visualisation data sets
CVE makes it easy to use data sets of 1,000 or even more variables so that, for the first time ever, you can see a ‘feed to product’ envelope spanning several process units and gain new knowledge of what process activities in which unit lead to you meeting or missing end-of-line targets, KPIs and specifications.
Analysing time dependant phenomena
CVE has tools for breaking out your process by stage, phase, or time before and after arbitrary triggers, allowing analysis of startups, grade transitions, and complex batch and semi-batch processes. These tools also enable event forensics, examining what happens before and after abnormal process events. This extends our powerful analytics to a broad range of processes.
Sophisticated tools for identifying key variables
CVE has been developed to visually break down your entire operation process, then extract and exploit the wealth of information available. PPCL have developed a suite of custom tools and techniques to leverage the data. Understanding your process behaviour is key to unlocking benefits such as higher throughput, better product, lowest costs, less waste, and more uptime.
Better operator alarm limits
Our technology provides a wholly new method for rationalizing operator alarms by positioning alarm limits at the boundary of a multi-variable Operating Window related to an Operating Envelope. Alarm performance is predictable and dramatically improved, leading to much greater operator belief in alarms and faster response – which in turn contribute to better process economics, fewer plant trips and increased process safety.
Easily understand large data sets
You don't need to be a data scientist to understand large data sets when using CVE. Process engineers can directly leverage their process knowledge without mathematical intervention.
Linking KPI's to process conditions
CVE helps you find which variables are contributing most to variability. Find the Operating Windows and Envelopes that show you where to operate to meet all your KPIs.
Why not book a demo and see for yourself how CVE can transform your process plant!
Testimonials


Discover how to run optimised intelligent
process plant operations:
Analyze
Explore, Interrogate and identify areas of improvement from your plant's past performance. See your entire plant process in one visualization tool. What makes CVE unique is the thousands of variants from multiple datasets brought together to be analysed at the same time. With advanced filtering options, you can discover new insights and patterns that can truly make a difference.
Improve
Once you identify actionable improvements in your process, you can begin optimising your operating envelope and set new alarm limits. Using CVE to visualize each and every part of the production process, enables actionable behaviours or small corrections to be made at all levels of the plant.

Monitor
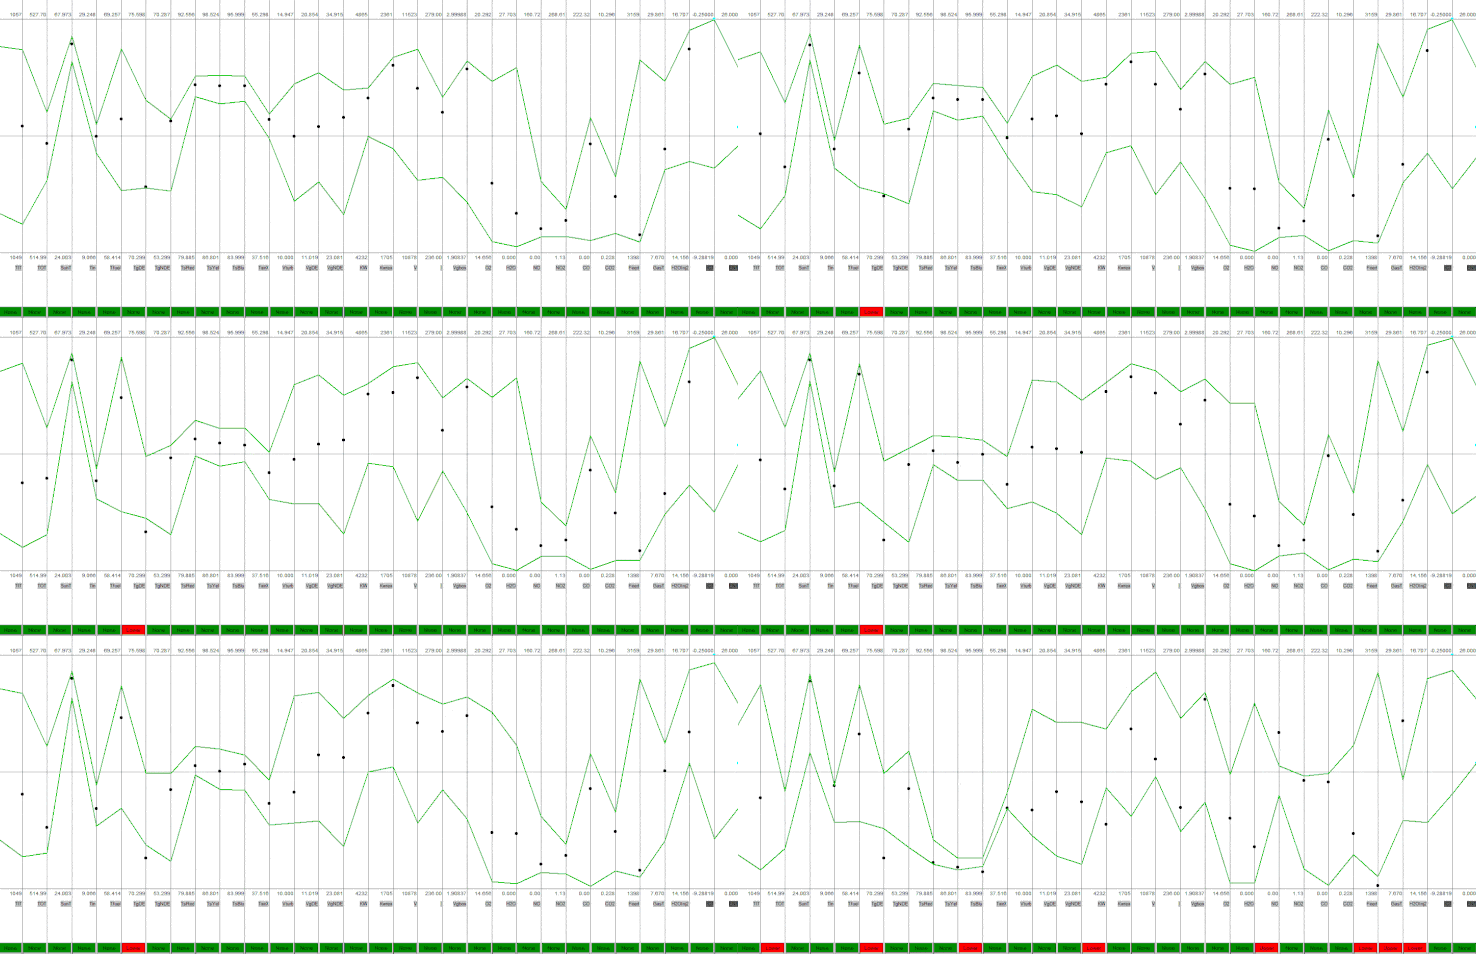
Get real-time alerts through CPM to keep your process in-line. The software monitors your process 24/7 and visually updates all operating variables within our visualisation tool to alert and prevent production issues. Control engineers have access to a display that tells, at a glance, whether the process is under control and operating within set operating envelopes. In alarm systems, CPM generates alerts that have the objective of keeping the process inside the fixed HiLo Alarm Limits found by CVE, allowing an increased level of process safety.
Control
Manage your plants ongoing performance with full operational insights by combining CVE & CPM. Utilising these powerful technologies on a daily basis, allows control engineers to run intelligent operations that maximise performance output, meet many KPI's and minimise safety risks. As the digitization of process plant continues, PPCL offer solutions and techniques that enable true data-driven decisions for improving all areas of your plant's production.
Ready To Get Started?

1 - Book A Demo

2 - Build Intelligent Operating Envelopes

3 - Gain New Process Improvements
Versatile Software For Many Processing industries
We have products transforming process plant operations worldwide in a large number of industries:
Oil & Gas Refineries
Petro Chemical Plants
Power Generation
Pharmaceutical
Food & Beverage
Minerals Processing
Pulp & Paper
Mining & Metals
Water & Wastewater
Selection Of Our Customers
What Sets PPCL Apart?
Specialized Support
With decades of experience in Process Plant operations, our team know how to help.
Reliable
Purpose built offline software tools with a strong reputation for reliability. Our tools have over two decades of research & development.
Fast & Secure
Quickly compile, enhance, and deliver high-volume, high-fidelity, real-time data within your secure networks.
Backed By Experts
Experienced Chemical engineers helping enterprises achieve operational insights.
Are your process problems getting
out of control?
PPCL Consulting Services can come to you, investigate your process and give you the information you
need to get things back on track and in line with business objectives.
Testimonials


Webinar Replays:
On Demand Webinars
All the latest PPCL webinars are available to watch at your convenience.
Let's Work Together
We’ve been delivering process plant software solutions for nearly 30 years. Why not book a demo and see for yourself how CVE & CPM can transform your process plant.
