GPC in Pharma!
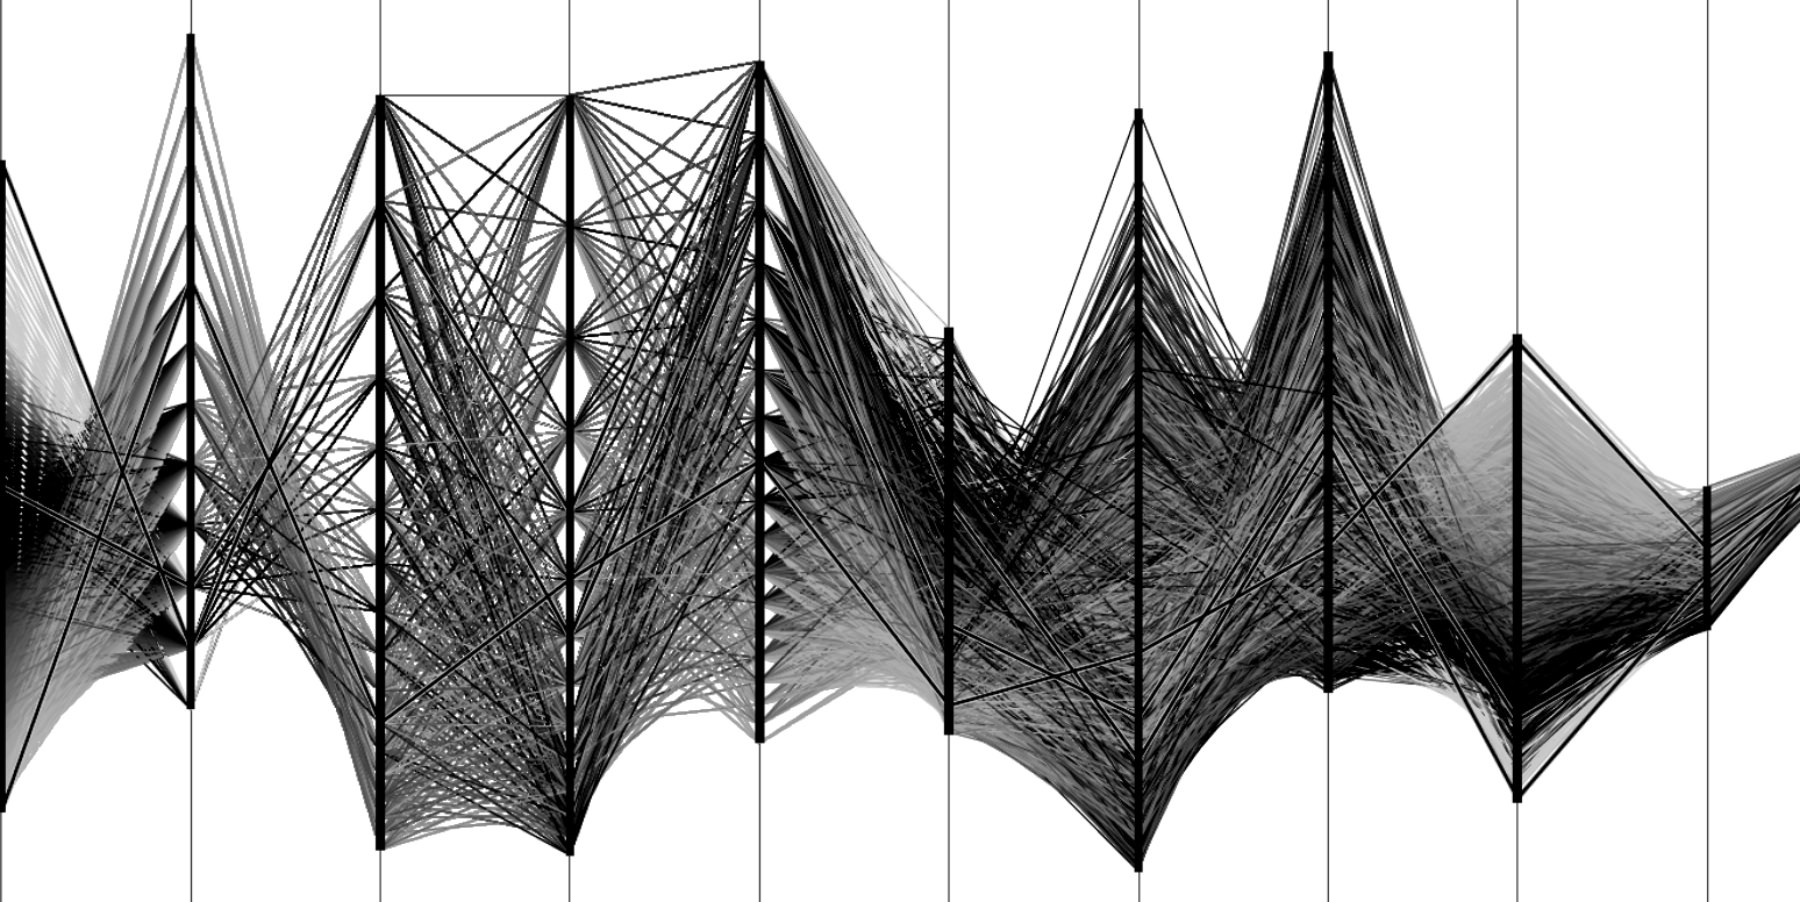
Real-world concepts and situations relating to Pharmaceutical Companies require more than 2/3 variables, making visualising these problems more complex.

Real-world concepts and situations relating to Pharmaceutical Companies require more than 2/3 variables, making visualising these problems more complex.

People often ask what system changes are required to implement any of our products. The answer is – usually none, it’s that simple.

Why are some batches better than others? Probably because there has never been a way to compare two or more batches, let alone several batches made in each of two reactors.

Ever find that your process historian is excellent at capturing valuable data but then you have little time to truly understand what the data is trying to tell you?

Often the case with many things is that you don’t know what you’re missing. In the world of process control it is no different.

he root-cause of Alarm Rationalisation having been such a tedious and time-consuming procedure has been the lack of any capability for Alarm Performance Prediction (APP).

Our solution to the multi-variable product quality control problem is very different, complete and available now.

Geometric Process Control (GPC) technology can be successfully applied to DOE through the C Response Surface Visualiser (CRSV) tool.

2/3rds of the processing capacity of the human brain is devoted to visual processing, showing we all find pictures easier to understand than words or numbers.
Copyright © 2011 – 2024 PPCL. Process Plant Computing Limited. All rights reserved
PPCL products are proudly developed with ❤ in the UK