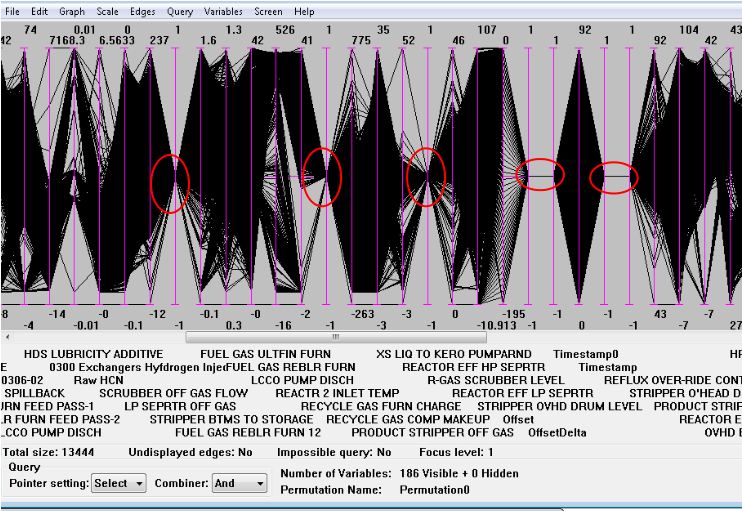
When we start exploring data in CVE, there are often some variables that are single-valued, that is, all of the data has been reported as the same value. This could be because it is an unchanging set-point, always-closed (or open) valve position, a broken measurement, or misconfiguration somewhere upstream of the plant historian.
Usually we will briefly investigate these variables, spending long if they have significance (alarms configured on them, for instance), and them hide them, removing them from further consideration, as there is no useful information content in a single-valued variable. This can easily be done by hand when there are a handful of them, and it’s easy to do as they are very visually distinctive on the parallel plot.
These variables are easily seen in CVE, as seen in the following plot.
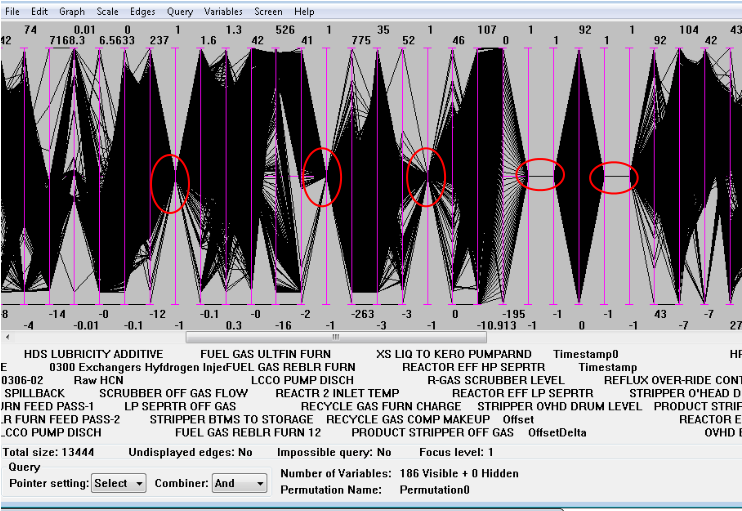
When there are only a handful, as here, it’s easy to spot them in passing, investigate, and then hide them (right-click on the variable label, and choose Hide). But when there are tens or more, as might happen when doing alarm work, sometimes you just want to hide them all. Or maybe export the variable IDs and then hide them. How can we do that quickly?
We’ll basically use the Alarm Count variable to find all variables that are single valued, then select them all. Once they’re selected we have lots of options: hide them in bulk, drop some edges on them and export the query to export the identifiers, etc.
Method
This assumes there are less than about 1000 variables, due to reasons mentioned down in the Notes section. If you have more, you can work on a portion (half or third) of the dataset at a time.
We’re going to use automatic scaling and the Alarm Count variable to identify all the variables that are single valued. The approach will be to scale the range on the variables to the full range of the data, then add ranges at about ±10% around the midpoint. If the data is single-valued, 100% of it will be in this range, otherwise some will be outside at the edge of the scale. The Alarm Count variable lets us find this, and pick out those variables.
- Add a new query. We’ll use this to put the ranges on to select the data near the (vertical) middle of the plot.
- Select the variables we’re interested in. This will usually be all the process variables, there’s normally no need to do the date/time variables or the lab qualities. I’ll usually do this by clicking the variable label just right of the dates, then scrolling all the way to the right of the parallel plot and shift-clicking the last targeted variable.
- Right-click on the parallel plot ABOVE the midpoint. The above is really important, as it will be the location the top of the ranges will be. Select “Range” from the dropdown. This adds range shapes to the added query on all the selected variables.
- The bottom of the range (upward facing triangles) is selected on all the variables. Drag this down to below the midpoint. CVE should now look something like this
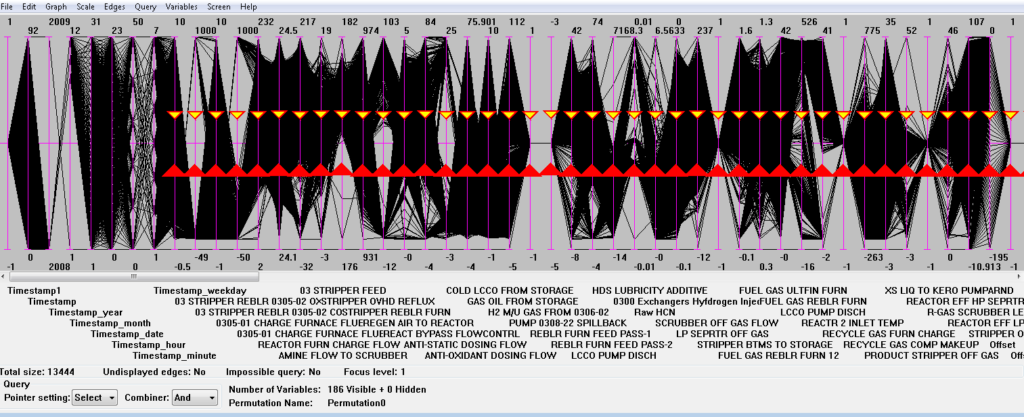
5. Select the date-time variable, here Timestamp, and add a new Alarm Count variable.
6. A Pareto will pop up. We want the variables that are never “in alarm.” These will be at the far right (or you could use “Smallest First”). Find the leftmost that has zero, and double check by using “Locate Variable” that it is indeed single-valued. Then shift-click the variable label at the far right in the Pareto to select all these variables.
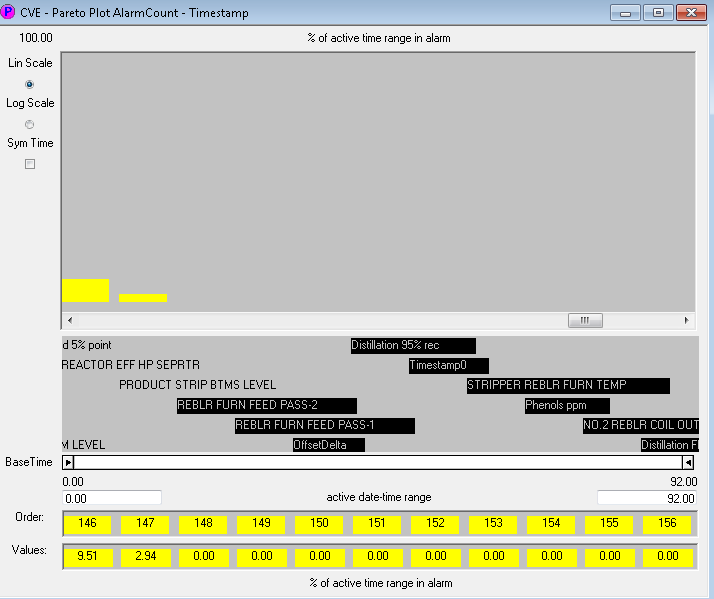
7. You can then right-click and choose “Locate Variables” and all of these will be selected on the parallel plot. I’d usually move them all together at the right of the parallel plot to double check visibly before hiding them.
8. If you’d like to export the list of variables to make a list to investigate, you could export the Pareto plot values (CVE 2.8.2 or later), or add ranges to a new query, then export the query.
If you think a short video showing this would be useful, or have any other comments, please contact us at enquiries@ppcl.com and let us know.
Notes
Currently (2.8.0 & 2.8.2) CVE may crash if you create a query with ranges on more than 1000 variables. Normally this doesn’t come up with what we usually use queries for, but it may in this application. Just do half the variables (or a third…) at a time.

